I was interested in learning a little bit more about data science and machine learning algorithms. And one of the most used data sets to introduce one to the topic is the iris data set. The iris data set contains 150 instances with a classifier describing which kind of iris plant type it is: iris setosa, iris versicolor and iris virginica. We have 50 instances of each class in the data set. Each instance describes the plants sepal length, sepal width, petal length and petal width. And now only given the information of these 4 values, a classifier should be able to accurately predict what kind of plant type the instance is.
Here is the iris data set I have used for the following plot. It only differs from the data set in the UC Irvine Machine Learning Repository by an additional line in the CSV file describing what each column signifies:
So this is how the beginning of the csv file will look like to you, when you open it in a text editor:
sepal-length,sepal-width,petal-length,petal-width,classification
5.1,3.5,1.4,0.2,Iris-setosa
4.9,3.0,1.4,0.2,Iris-setosa
4.7,3.2,1.3,0.2,Iris-setosa
⋮ , ⋮ , ⋮ , ⋮ , ⋮
Matplotlib
I decided to use the iris data set to learn more on how to use matplotlib. Matplotlib is an open source project, which enables you to create 2D plots in python. You can create a lot of different kinds of charts, graphs and even animations. This is very useful, since a good visualization of a given data set can help you recognize, which feature in the instance has a high relevance to determine the classification, just by using your “naked eye”.
Luckly, matplotlib offers an extensive library of examples on their website with additional images or animations the code would produce, which made it easy for me to find, what I was looking for. And this was what I was able to produce just in my first hour of using matplotlib:
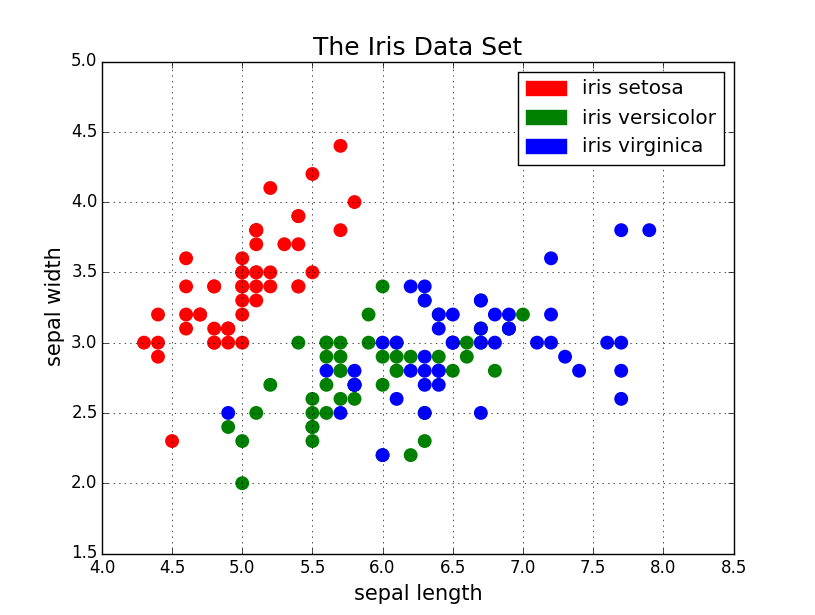
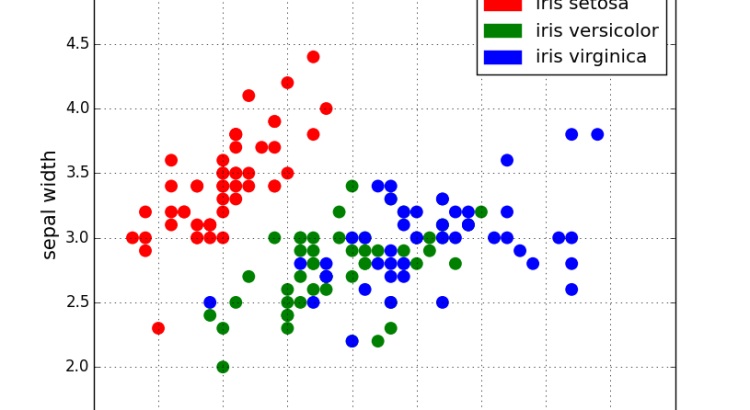
Scatter Graph of the Iris data set
Here’s also the complete code:
import numpy as np
import matplotlib.patches as mpatches
import matplotlib.pyplot as plt

"""
	Desc: 	1. sepal-length
			2. sepal-width
			3. petal-length
			4. petal-width
			5. classification
				- Iris-setosa
				- Iris-versicolor
				- Iris-virginica
"""
dataset = np.genfromtxt('../iris.csv', delimiter=',', dtype=None)[1:]
lengths = [x[0:4] for x in dataset]
flower_type = [x[4] for x in dataset]

for i in range(0,len(lengths)-1):
	x, y = [lengths[i][0], lengths[i][1]]
	scale = 100.0
	# determine color
	flower = flower_type[i].decode("utf-8")
	color = ""
	if flower == "Iris-setosa":
		color = "red"
	elif flower == "Iris-versicolor":
		color = "green"
	elif flower == "Iris-virginica":
		color = "blue"

	plt.scatter(x, y, s=scale, c=color, alpha=1, edgecolor="none")

# Legend
red_patch = mpatches.Patch(color='red', label='iris setosa')
green_patch = mpatches.Patch(color='green', label='iris versicolor')
blue_patch = mpatches.Patch(color='blue', label='iris virginica')
plt.legend(handles=[red_patch, green_patch, blue_patch])

plt.title("The Iris Data Set", fontsize=18)
plt.xlabel(r'sepal length', fontsize=15)
plt.ylabel(r'sepal width', fontsize=15)

plt.legend()
plt.grid(True)

plt.show()
I also used the NumPy module for the genfromtxt() function, which offers a easy way to read info from a csv file. Notice that I skipped the first line of the csv file, since that line only offers a description of the columns. The rest of the code is pretty self-explaining and not too complicated.
We can see, that there two clusters in the scatter plot. Almost all instances except a few outliers of the iris setosa test cluster around the top-left of the graph. The other instances of the iris versicolor and the iris vriginica (respectively green and blue) are mixed up in one bigger cluster. This shows us, that the sepal width and sepal length are good features to determine if the instance is of type iris setosa or not, but wouldn’t perform very well in differentiating between iris versicolor and iris virginica.
This was a short introduction and demonstration of how a good visualization of a data set can help in deciding on how to approach a problem. It also helps you better understand how the given data looks like and matplotlib is a helpful module to produce good looking graphs.
The post My first time using matplotlib appeared first on Rather Read.