Welcome back. With Angular set up along with a loading spinner and our refactored Angular controller, let’s move on to the final part and create a custom Angular Directive to display a frequency distribution chart with JavaScript and the D3 library.
Remember: Here’s what we’re building – A Flask app that calculates word-frequency pairs based on the text from a given URL.
- Part One: Set up a local development environment and then deploy both a staging and a production environment on Heroku.
- Part Two: Set up a PostgreSQL database along with SQLAlchemy and Alembic to handle migrations.
- Part Three: Add in the back-end logic to scrape and then process the word counts from a webpage using the requests, BeautifulSoup, and Natural Language Toolkit (NLTK) libraries.
- Part Four: Implement a Redis task queue to handle the text processing.
- Part Five: Set up Angular on the front-end to continuously poll the back-end to see if the request is done processing.
- Part Six: Push to the staging server on Heroku – setting up Redis and detailing how to run two processes (web and worker) on a single Dyno.
- Part Seven: Update the front-end to make it more user-friendly.
- Part Eight: Create a custom Angular Directive to display a frequency distribution chart using JavaScript and D3. (current)
Need the code? Grab it from the repo.
Let’s look at what we currently have…
Current User Interface
Start Redis in a terminal window:
$ redis-server
Then get your process worker going in another window:
$ cd flask-by-example
$ python worker.py
17:11:39 RQ worker started, version 0.4.6
17:11:39
17:11:39 *** Listening on default...
Finally, in a third window, fire up the app:
$ cd flask-by-example
$ python manage.py runserver
You should see your word counter working. Now we can add in a custom Angular Directive to display the results in a D3 chart.
Angular Directive
Start by adding the D3 library (v3) to the index.html file:
<!-- scripts -->
<script src="//d3js.org/d3.v3.min.js" charset="utf-8"></script>
<script src="//code.jquery.com/jquery-2.2.1.min.js"></script>
<script src="//netdna.bootstrapcdn.com/bootstrap/3.3.6/js/bootstrap.min.js"></script>
<script src="//ajax.googleapis.com/ajax/libs/angularjs/1.4.5/angular.min.js"></script>
<script src="{{ url_for('static', filename='main.js') }}"></script>
Now let’s set up a new custom Directive.
Angular Directives are markers on a DOM element, which allow us to insert sections of HTML with specific events and attributes attached to it. Let’s build out the first part of our Directive by adding the following code just below the controller in main.js:
.directive('wordCountChart', ['$parse', function ($parse) {
  return {
    restrict: 'E',
    replace: true,
    template: '<div id="chart"></div>',
    link: function (scope) {}
   };
}]);
restrict: 'E' creates a Directive that is restricted to an HTML element. replace: true simply replaces the HTML Directive with the HTML in the template. The link function gives us access to variables in the scope defined in the controller.
Next, add a watch function to “watch” for any changes to the variables and respond appropriately. Add this to the link function like so:
link: function (scope) {
  scope.$watch('wordcounts', function() {
    // add code here
  }, true);
}
Finally, add the Directive just below the closing divider to <div class="row">:
<br>
<word-count-chart data="wordcounts"></word-count-chart>
With the Directive set up, let’s turn our attention to the D3 library…
D3 Bar Chart
D3 is a powerful library that utilizes HTML, CSS, and SVG to display data on the DOM and JavaScript to make it interactive. We will use it to create a basic bar chart.
Step 1: Functional Logic
Add the following to the watch function within the Angular Directive:
scope.$watch('wordcounts', function() {
  var data = scope.wordcounts;
  for (var word in data) {
    d3.select('#chart')
      .append('div')
      .selectAll('div')
      .data(word[0])
      .enter()
      .append('div');
  }
}, true);
Now, whenever scope.wordcounts changes, this function is fired, which updates the DOM. Since an object is returned from the AJAX request, we iterate through it to add the specific data to the chart. Essentially, every word is appended to a new div via a data join.
Try running the code.
What happens? Nothing shows up, right? Check out the DOM in Chrome’s Developer Tools, after you submit a new site. You should see a number of nested divs. We just need to add styles…
Step 2: Styling the Bar Chart
Start with some simple CSS:
#chart {
  overflow-y: scroll;
}

#chart {
  background: #eee;
  padding: 3px;
}

#chart div {
  width: 0;
  transition: all 1s ease-out;
  -moz-transition: all 1s ease-out;
  -webkit-transition: all 1s ease-out;
}

#chart div {
  height: 30px;
  font: 15px;
  background-color: #006dcc;
  text-align: right;
  padding: 3px;
  color: white;
  box-shadow: 2px 2px 2px gray;
}
Make sure to include this at the top of HTML page, after the Bootstrap stylesheet:
<link rel="stylesheet" type="text/css" href="../static/main.css">
Fire up the app in our browser. What’s happening now?
When you search for a website, you should now see a grey area with some thin blue bars on the left hand side. So you can see that we are generating a bar for each data element we’re getting back – 10 in total. However, we need to modify our D3 code in order to increase the width of each bar so they are readable.
Step 3: Making the Bar Chart More Interactive
We can chain this on to our existing code and use the D3 style function:
scope.$watch('wordcounts', function() {
  var data = scope.wordcounts;
  for (var word in data) {
    d3.select('#chart')
      .append('div')
      .selectAll('div')
      .data(word[0])
      .enter()
      .append('div')
      .style('width', function() {
        return (data[word] * 20) + 'px';
      })
      .text(function(d){
        return word;
      });
  }
}, true);
Now we are dynamically creating a width based on the numeric value of how often a word shows up on a webpage:
.style('width', function() {
  return (data[word] * 20) + 'px';
})
.text(function(d){
  return word;
});
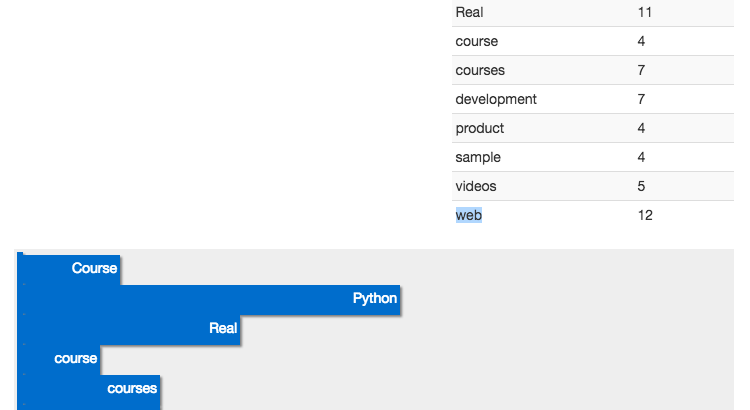
The style is calculated by returning the value associated with each word, multiplying that number by 20, and then converting it into pixels. We can also add text to each bar element by inserting the string value of the word along with how often it shows up on the page.
Try this out. You should see something like:
There’s still one thing missing though. What happens when you search for a new website? Try it. The new chart is appended beneath the previous one. We need to clear out our chart div before a new one is created.
Step 4: Clean Up for the Next URL Search
Update the link function in the Directive:
link: function (scope) {
  scope.$watch('wordcounts', function() {
    d3.select('#chart').selectAll('*').remove();
    var data = scope.wordcounts;
    for (var word in data) {
      d3.select('#chart')
        .append('div')
        .selectAll('div')
        .data(word[0])
        .enter()
        .append('div')
        .style('width', function() {
          return (data[word] * 20) + 'px';
        })
        .text(function(d){
          return word;
        });
    }
  }, true);
}
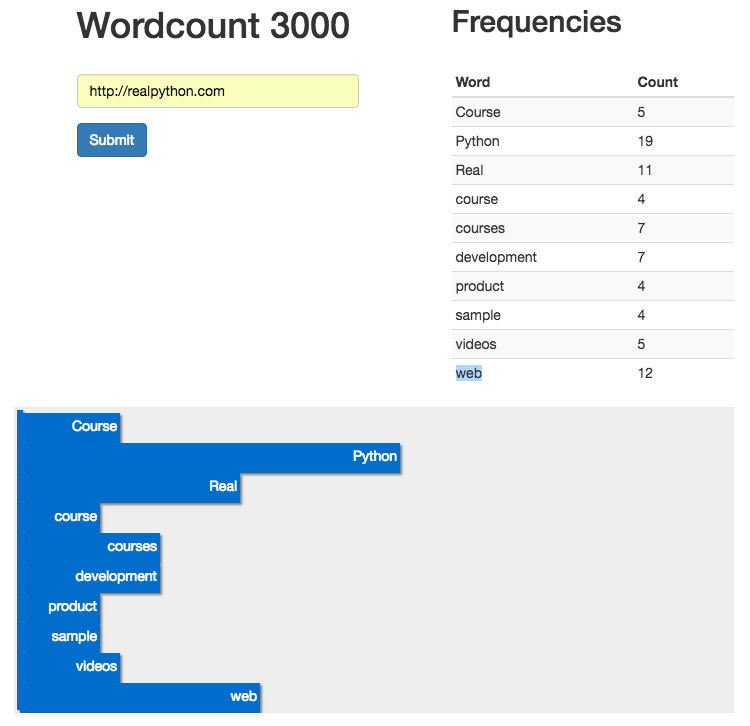
d3.select('#chart').selectAll('*').remove(); simply clears out the chart each time the $scope.watch function is fired. Now we have a chart that is cleared before each new use, and we have a fully functional word count application!!
Test it out!
Conclusion and Next Steps
That’s it. Push your changes to the staging and production servers. Let’s review what we tackled:
- We started with the configuration and workflow, setting up staging and production servers
- From there, we added the basic functionality – web scraping, data analysis – and set up a task queue with Redis
- With the back-end functionality set up, attention turned to the front-end where we added Angular, built a custom Directive, and added D3 into the mix
We have an MVP, but there’s still much to be done:
- Refactor, refactor, refactor!
- Write tests
- Handle errors and exceptions
- Abstract out state in the Angular app to a Service
- Work on the UI and UX
Want to help? Add a feature, write part 9, get paid, and become Internet famous!
Links: