I’m always working with stock market data and stock market indicators. During this work, there’s times that I need to calculate things like Relative Strength Index (RSI), Average True Range (ATR), Commodity Channel Index (CCI) and other various indicators and stats.
My go-to for this type of work is TA-Lib and the python wrapper for TA-Lib but there’s times when I can’t install and configure TA-Lib on a computer. When this occurs, I then have to go find the various algorithms to calculate the various indicators / stats that I need. When this happens, I usually end up making mistakes and/or taking longer than I really should to get these algo’s built to use in a project. Of course I re-use what I can when I can but many times I’ve forgotten that I built an RSI function in the past and recreate.
I found myself in this situation today. I need an RSI calculation for some work I’m doing. I couldn’t get TA-Lib installed and working on the machine I was working on (no clue what was wrong either) so I decided to write my own indicator. While looking around the web for a good algorithm to use, I ran across a new module that I hadn’t see before called stockstats.
Stockstats is a wrapper for pandas dataframes and provides the ability to calculate many different stock market indicators / statistics. The fact that it is a simple wrapper around pandas is ideal since I do 99% of my work within pandas.
To use stockstats, you simply to to ‘convert’ a pandas dataframe to a stockstats dataframe. This can be done like so:
stockstats_df = StockDataFrame.retype(df)
Then, to calculate the RSI for this dataframe, all you need to do is pass a command into the stockstats dataframe.
stock['rsi_14']
The above calculates the 14-day RSI for the entire dataframe.
Let’s look at a full example using data from yahoo.
First, import the modules we’ll need:
import pandas as pd
import pandas.io.data as web
from stockstats import StockDataFrame as Sdf
Pull down all the historical data for the S&P 500 ETF (SPY):
data = web.get_data_yahoo('SPY')
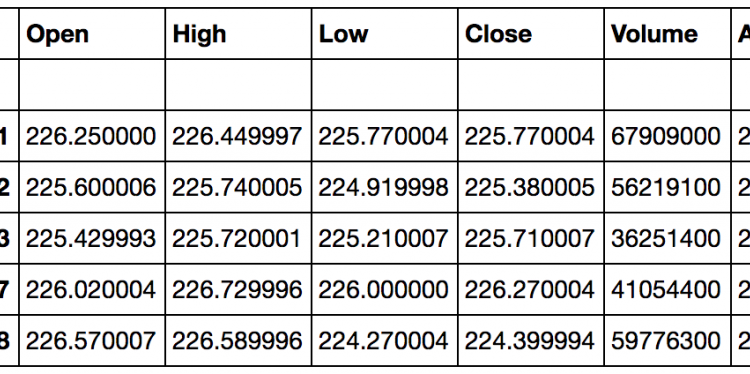
Taking a look at the ‘tail’ of the data gives us something like the data in Table 1.

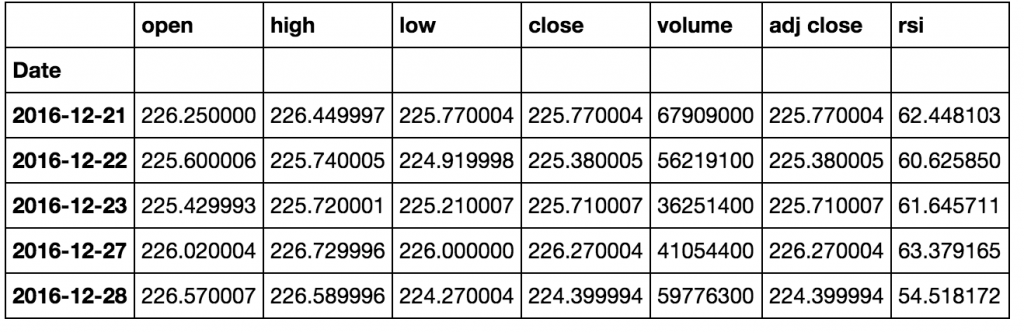
To calculate RSI, retype the pandas dataframe into a stockstats dataframe and then calculate the 14-day RSI.
stock_df = Sdf.retype(data)
data['rsi']=stock_df['rsi_14']
With this approach, you end up with some extra columns in your dataframe. These can easily be removed with the ‘del’ command.
del data['close_-1_s']
del data['close_-1_d']
del data['rs_14']
del data['rsi_14']
With these extra columns removed, you now have the 14-day RSI values a column titled “rsi”.
One caveat on this approach – stockstats seems to take the ‘close’ column. This might or might not be an issue for you if you are wanting to use the Adj Close column provided by yahoo. This is a simple fix (delete the ‘close’ and rename ‘adj close’ to ‘close’).
Stockstats currently has about 26 stats and stock market indicators included. Definitely not as robust as TA-Lib, but it does have the basics. If you are working with stock market data and need some quick indicators / statistics and can’t (or don’t want to) install TA-Lib, check out stockstats.
The post Stockstats – Python module for various stock market indicators appeared first on Python Data.