In this brief Python data analysis tutorial we will learn how to carry out a repeated measures ANOVA using Statsmodels. More specifically, we will learn how to use the AnovaRM class from statsmodels anova module.
To follow this guide you will need to have Python, Statsmodels, Pandas, and their dependencies installed. One easy way to get these Python packages installed is to install a Python distribituion such as Anaconda (see this YouTube Video on how to install Anaconda). However, if you already have Python installed you can of course use Pip.
How to carry out repeated measures ANOVA using other Python packages:
This short tutorial are devided so that we will learn how to install Statsmodels and Pandas, carrying out one-way and two-way ANOVA using statsmodels. Finally, there is a YouTube video showing how to carry out repeated measures ANOVA using Statsmodels and R. This Youtube video will also show some of the differences between Statsmodel and the r-package afex and the function aov_ez.
How to Install Statsmodels & Pandas
Statsmodels and Panda can easily be installed using pip:
pip install pandas statsmodels
How to Use AnovaRM to Carry Out a Repeated Measures ANOVA
In this section we are going to learn how to do a repeated measures ANOVA using Statsmodels. More specifically, we are going to learn how carry out a one-way ANOVA and two-way ANOVA in Python. The AnovaRM clas takes five arguments:
- data: the first argument should be a dataframe object.
- depvar: second should variable should be your dependent variable. Should be a string (e.g., ‘responsetime’)
- subject: here you put in your subject identifier. Should also be a string (e.g., ‘subject’)
- within: the within-subject factors in a lit of strings.
- aggregate_func: this is optional and should be use if the data contains more than a single observation per participant. Can be “mean” or a function. For instance, you can use Numpy mean (i.e., np.mean).
One-way ANOVA for Repeated Measures Using Statsmodels
First we start with the one-way ANOVA. In the examples below we are going to use Pandas and the AnovaRM class from statsmodels. In the first example, we are using Pandas to use read_csv to load this data into a dataframe. See my Python Pandas Dataframe tutorial if you need to learn more about Pandas dataframes.
import pandas as pd
from statsmodels.stats.anova import AnovaRM

df = pd.read_csv('rmAOV1way.csv')
We can use Pandas head() to have a look at the first five row (i.e., df.head()):
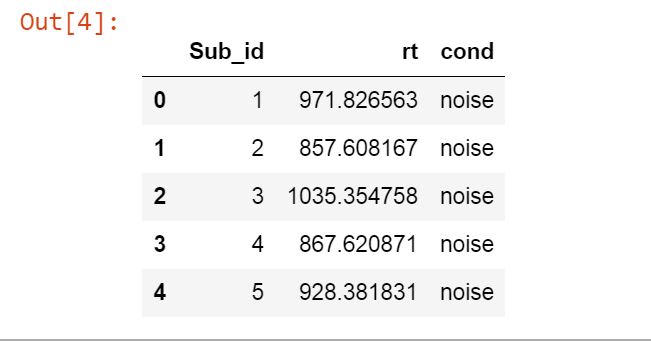
As can be seen above we have the columns Sub_id, rt, and cond. These columns represent the subject identifier, the dependent variable, and the independent variable, respectively. Note, there are two levels of cond (using df.cond.unique() will show us noise and quiet).
Python One-way Repeated Measures ANOVA Example:
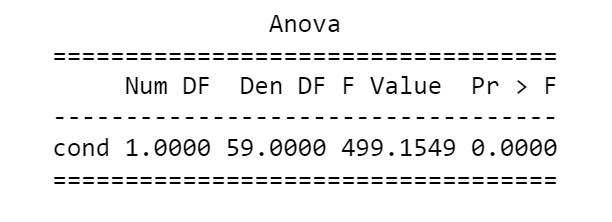
In the Statsmodels ANOVA example below we use our dataframe object, df, as the first argument, followed by our independent variable (‘rt’), subject identifier (‘Sub_id’), and the list of the dependend variable, ‘cond’. In the second row we are getting the fit so that we can print the ANOVA table.
aovrm = AnovaRM(df, 'rt', 'Sub_id', within=['cond'])
res = aovrm.fit()

print(res)
In the second example we will also use the parameter aggregate_func. Click here to download the dataset.
flanks = pd.read_csv('flanks.csv')
res = AnovaRM(flanks, 'RT', 'SubID', within=['TrialType'], aggregate_func='mean')

print(res.fit())
Two-way ANOVA for Repeated Measures Using Statsmodels
Finally, we continue with the two-way ANOVA. In the example below we are also using Pandas and the AnovaRM class from statsmodels. The example data can be downloaded here.
Two-Way ANOVA Using Statsmodels Example:
Notice the difference between the one-way ANOVA and the two-way ANOVA; the list now contains 2 variables.
df2way = pd.read_csv('rmAOV2way.csv')
aovrm2way = AnovaRM(df2way, 'rt', 'Sub_id', within=['iv1', 'iv2'])
res2way = aovrm2way.fit()
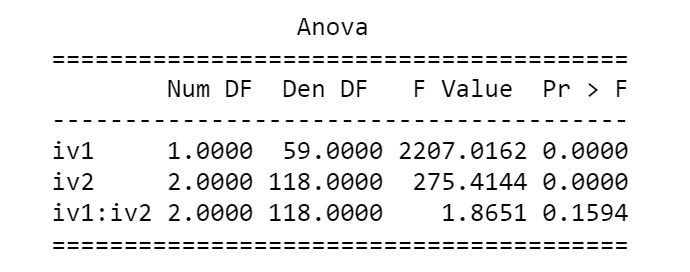
print(res2way)
The ANOVA table when carrying out a two-way ANOVA using Statsmodels look like this:
Repeated Measures ANOVA: R vs. Python
Finally, here’s the YouTube video covering how to carry out repeated measures ANOVA using Python and R. It will further show some of the differences between the function aov_ez and AnovaRM. Hint, there are more arguments available in aov_ez and it will calculate effect sizes, among other things.
That was it, now you know how to carry out one-way and two-way ANOVA for repeated measures using Python Statsmodels.
The post Repeated Measures ANOVA in Python using Statsmodels appeared first on Erik Marsja.