
Why Learn Python For Data Science? Before we explore how to learn Python for data science, we should briefly answer why you should learn Python in the first place. In short, understanding Python is one of the valuable skills needed for a data science career. Though it hasn’t always been, Python is the programming language […]
Category: Data Visualization
The Ultimate List of Data Science Podcasts
Podcasts are a great way to immerse yourself in an industry, especially when it comes to data science. The field moves extremely quickly, and it can be difficult to keep up with all the new developments happening each week! Take advantage of those times in the day when your body is busy, but your mind […]
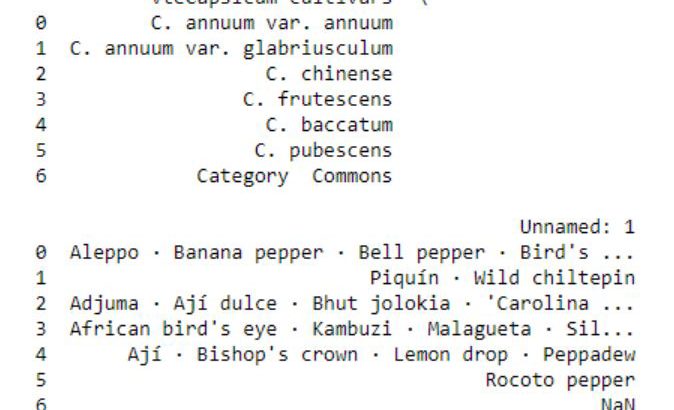
Explorative Data Analysis with Pandas, SciPy, and Seaborn
In this post we are going to learn to explore data using Python, Pandas, and Seaborn. The data we are going to explore is data from a Wikipedia article. In this post we are actually going to learn how to parse data from a URL, exploring this data by grouping it and data visualization. More […]

Interactive Data Visualization in Python With Bokeh
Bokeh prides itself on being a library for interactive data visualization. Unlike popular counterparts in the Python visualization space, like Matplotlib and Seaborn, Bokeh renders its graphics using HTML and JavaScript. This makes it a great candidate for building web-based dashboards and applications. However, it’s an equally powerful tool for exploring and understanding your data […]

The Best Python Books
Python is an amazing programming language. It can be applied to almost any programming task, allows for rapid development and debugging, and brings the support of what is arguably the most welcoming user community. Getting started with Python is like learning any new skill: it’s important to find a resource you connect with to guide […]
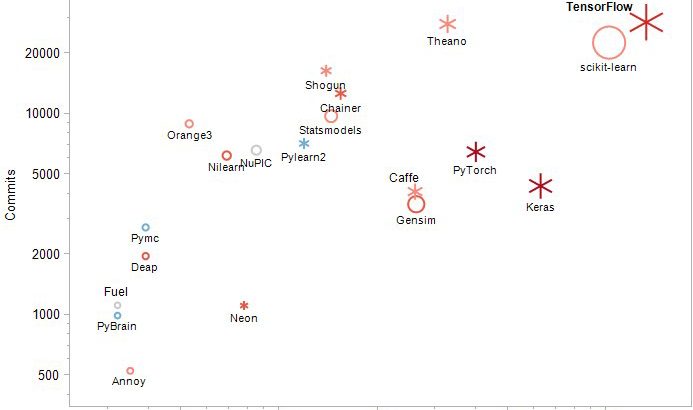
Top 20 Python AI and Machine Learning Open Source Projects
Getting into Machine Learning and AI is not an easy task. Many aspiring professionals and enthusiasts find it hard to establish a proper path into the field, given the enormous amount of resources available today. The field is evolving constantly and it is crucial that we keep up with the pace of this rapid development. […]
Programming Best Practices For Data Science
The data science life cycle is generally comprised of the following components: data retrieval data cleaning data exploration and visualization statistical or predictive modeling While these components are helpful for understanding the different phases, they don’t help us think about our programming workflow. Often, the entire data science life cycle ends up as an arbitrary […]
Generating Climate Temperature Spirals in Python
Ed Hawkins, a climate scientist, tweeted the following animated visualization in 2017 and captivated the world: This visualization shows the deviations from the average temperature between 1850 and 1900. It was reshared millions of times over Twitter and Facebook and a version of it was even shown at the opening ceremony for the Rio Olympics. […]
Adding Axis Labels to Plots With pandas
Pandas plotting methods provide an easy way to plot pandas objects. Often though, you’d like to add axis labels, which involves understanding the intricacies of Matplotlib syntax. Thankfully, there’s a way to do this entirely using pandas. Let’s start by importing the required libraries: import pandas as pd import numpy as np import matplotlib.pyplot as […]

Using Excel with pandas
Excel is one of the most popular and widely-used data tools; it’s hard to find an organization that doesn’t work with it in some way. From analysts, to sales VPs, to CEOs, various professionals use Excel for both quick stats and serious data crunching. With Excel being so pervasive, data professionals must be familiar with […]

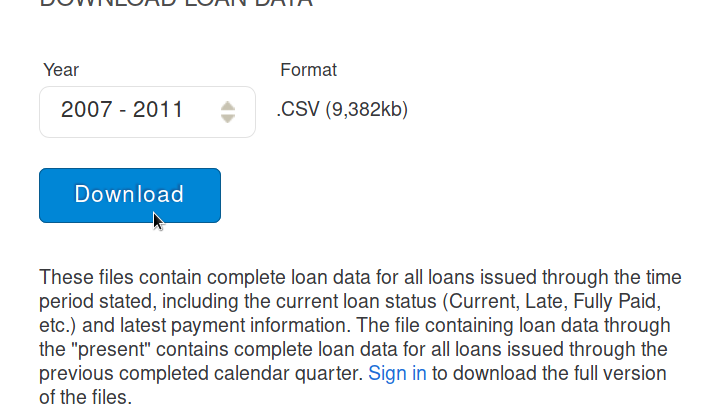
Web Scraping with Python and BeautifulSoup
To source data for data science projects, you’ll often rely on SQL and NoSQL databases, APIs, or ready-made CSV data sets. The problem is that you can’t always find a data set on your topic, databases are not kept current and APIs are either expensive or have usage limits. If the data you’re looking for […]
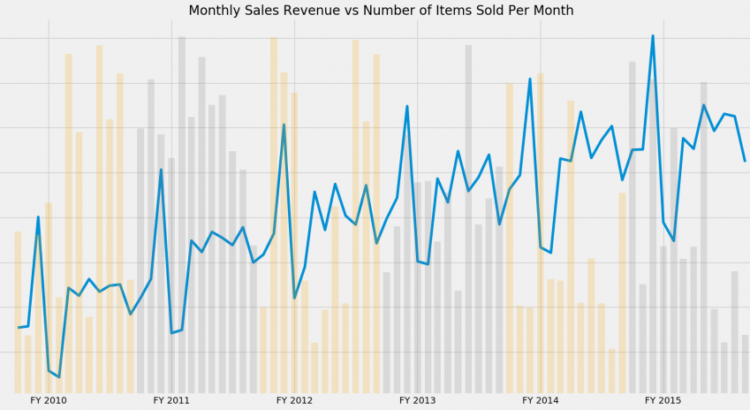
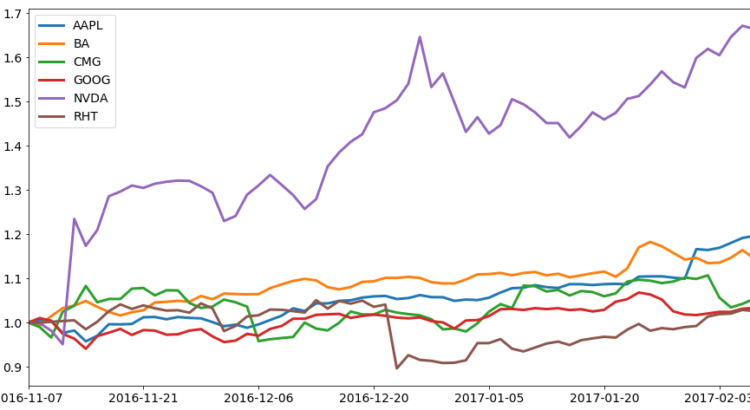
Visualizing data – overlaying charts in python
Visualizing data is vital to analyzing data. If you can’t see your data – and see it in multiple ways – you’ll have a hard time analyzing that data. There are quite a few ways to visualize data and, thankfully, with pandas, matplotlib and/or seaborn, you can make some pretty powerful visualizations during analysis. One of […]
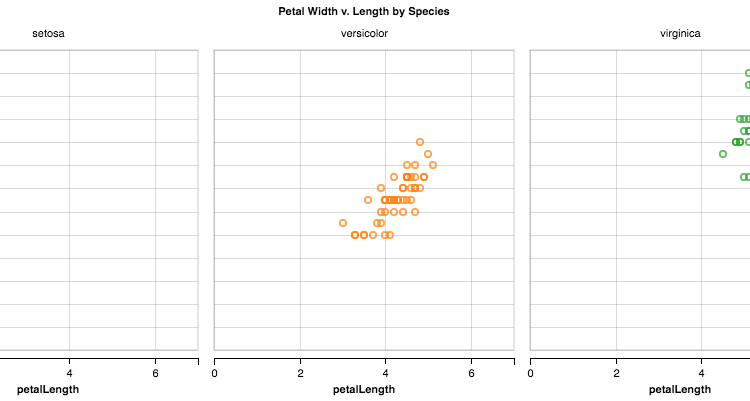
A Dramatic Tour through Python’s Data Visualization Landscape (including ggpy and Altair)
by Dan Saber | April 19, 2017 This post originally appeared on Dan Saber’s blog. We thought it was hilarious, so we asked him if we could repost it. He generously agreed! About Dan: My name is Dan Saber. I’m a UCLA math grad, and I do Data Science at Coursera. (Before that, I worked […]
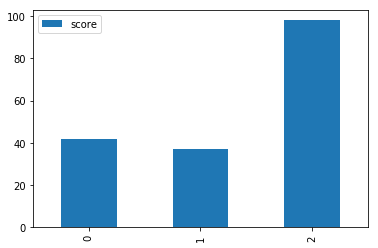
1 tip for effective data visualization in Python
Yes, you read correctly – this post will only give you 1 tip. I know most posts like this have 5 or more tips. I once saw a post with 15 tips, but I may have been daydreaming at the time. You’re probably wondering what makes this 1 tip so special. “Vik”, you may ask, […]

Becoming a Data Scientist
This blogpost is an excerpt of Springboard’s free guide to data science jobs and originally appeared on the Springboard blog. Data Science Skills Most data scientists use a combination of skills every day, some of which they have taught themselves on the job or otherwise. They also come from various backgrounds. There isn’t any one […]