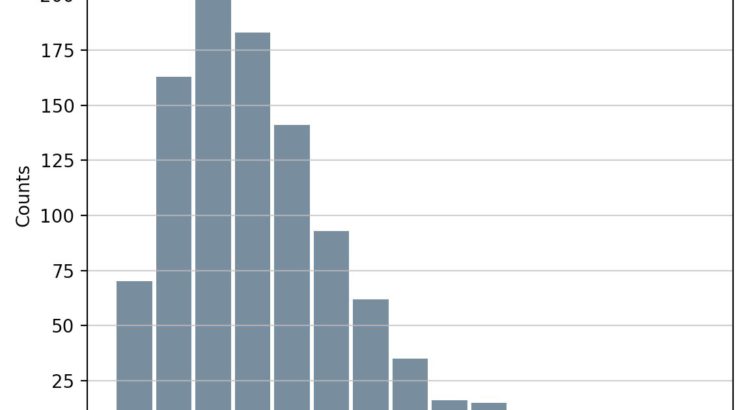
In this tutorial, you’ll be equipped to make production-quality, presentation-ready Python histogram plots with a range of choices and features. If you have introductory to intermediate knowledge in Python and statistics, you can use this article as a one-stop shop for building and plotting histograms in Python using libraries from its scientific stack, including NumPy, […]
Category: Matplotlib
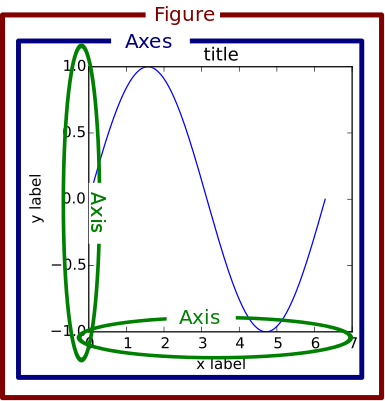
Python Plotting With Matplotlib (Guide)
A picture says a thousand words, and with Python’s matplotlib library, it fortunately takes far less than a thousand words of code to create a production-quality graphic. However, matplotlib is also a massive library, and getting a plot to look “just right” is often practiced on a trial-and-error basis. Using one-liners to generate basic plots […]
Matplotlib Plotting Cookbook Review
Here is my review I was given a copy of Matplotlib Plotting Cookbook by Alexandre Devert and asked to review it. Thanks PACKT! Here is my review. Preface But first, I’ll mention I’ve worked on two projects recently that involved rendering matplotlib graphs directly to the browser i.e. via content-type: image/png. This is fun! It’s […]