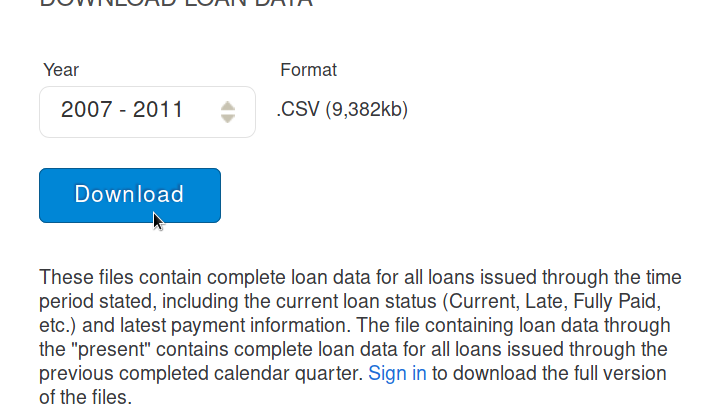
The data science life cycle is generally comprised of the following components: data retrieval data cleaning data exploration and visualization statistical or predictive modeling While these components are helpful for understanding the different phases, they don’t help us think about our programming workflow. Often, the entire data science life cycle ends up as an arbitrary […]
Author: Srini Kadamati
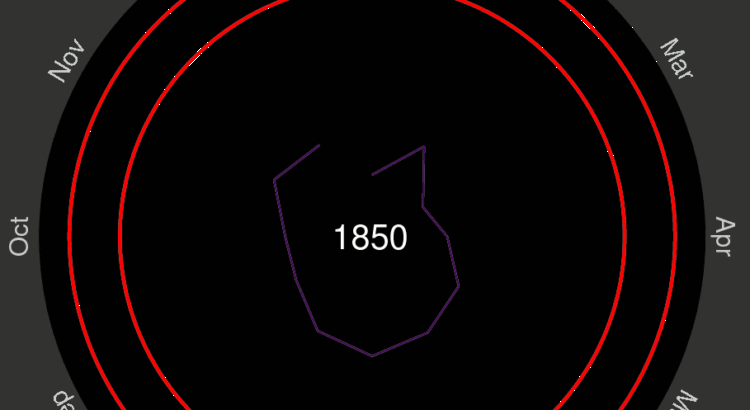
Generating Climate Temperature Spirals in Python
Ed Hawkins, a climate scientist, tweeted the following animated visualization in 2017 and captivated the world: This visualization shows the deviations from the average temperature between 1850 and 1900. It was reshared millions of times over Twitter and Facebook and a version of it was even shown at the opening ceremony for the Rio Olympics. […]