In these posts, I’ve been looking at using Prophet to forecast time series data at a monthly level using sales revenue data. In this post, I want to look at a very interesting aspect of Prophet (and time series analysis) that most people overlook – that of trend changepoints. This is the fourth in a series of posts about using Prophet to forecast time series data. The other parts can be found here:
- Forecasting Time Series data with Prophet – Part 1
- Forecasting Time Series data with Prophet – Part 2
- Forecasting Time Series data with Prophet – Part 3
Trend changepoint detection isn’t an easy thing to do. You could take the naive approach and just find local maxima and minima but those may or may not be changes in the overall trend of your signal. There are many different methods for changepoint detection (a good paper looking at four methods can be found here – Trend analysis and change point techniques: a survey) but thankfully Prophet does trend changepoint detection behind the scenes for us (and it does a pretty good job of it).
For most people / tasks, the automatic detection performed by Prophet is good enough, but it never hurts to know how to tweak Prophet in case it misses some changepoints.
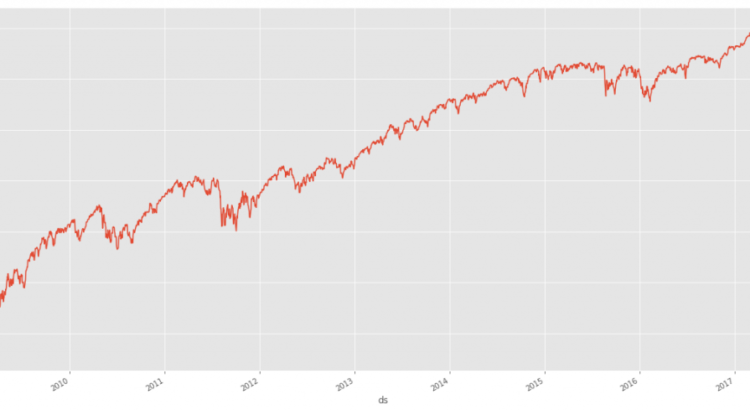
I’ve uploaded a jupyter notebook here and the sample data that I’m using here. Rather than use the monthly sales data I’ve been using, i wanted to use something that has a bit more of a noticable trend so I grabbed the S&P 500 index from FRED.
The jupyter notebook has bit more detail about loading data and running prophet for this data, so I’ll just throw the commands here and you can jump over there to see more detail. These first steps are no different than the standard data loading / prep for prophet discussed in previous posts.
market_df = pd.read_csv('../examples/SP500.csv', index_col='DATE', parse_dates=True)
df = market_df.reset_index().rename(columns={'DATE':'ds', 'SP500':'y'})
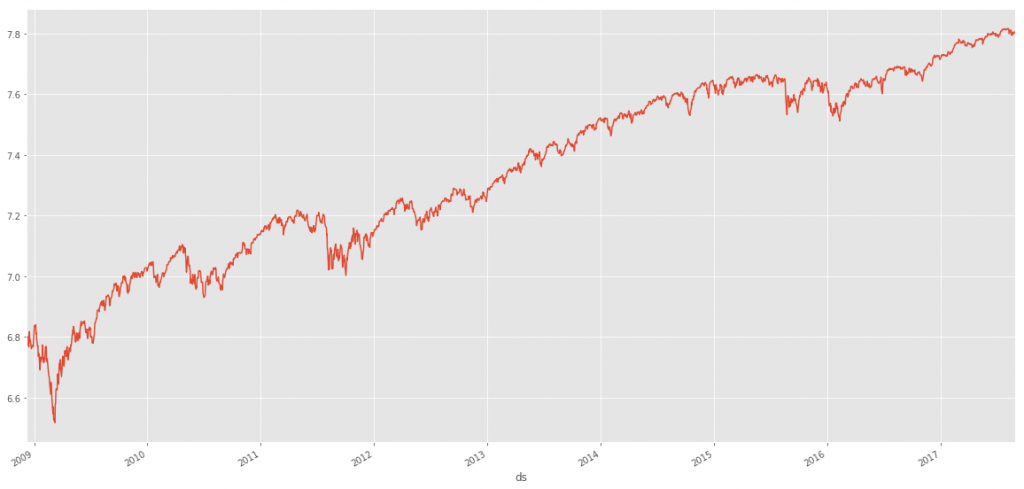
df['y'] = np.log(df['y'])
#lets take a look at our data quickly
df.set_index('ds').y.plot()
Now, let’s run prophet. Again, this is no different than the steps we’ve taken in previous posts for prophet.
model = Prophet()
model.fit(df);
future = model.make_future_dataframe(periods=366)
forecast = model.predict(future)
Prophet has created our model and fit the data. It has also (behind the scenes) created some potential changepoints. We can access these changepoints with .changepoints. By default, Prophet adds 25 changepoints into the initial 80% of the data-set. The number of changepoints can be set by using the n_changepoints parameter when initializing prophet (e.g., model=Prophet(n_changepoints=30).
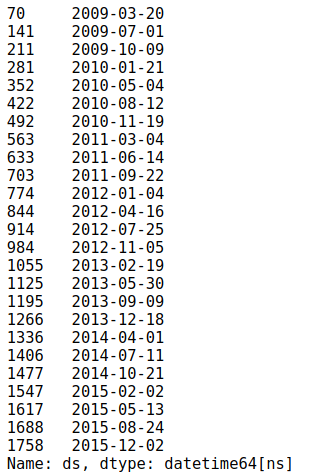
You can view the changepoints by typing the following:
model.changepoints
In addition to viewing the dates of the changepoints, we can also view a chart with changepoints added.
figure = model.plot(forecast)
for changepoint in model.changepoints:
    plt.axvline(changepoint,ls='--', lw=1)
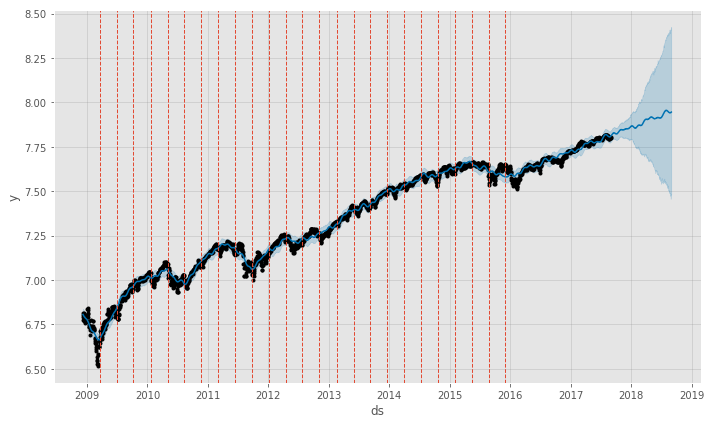
Taking a look at the possible changepoints (drawn in orange/red) in the above chart, we can see they fit pretty well with some of the highs and lows.
Prophet will also let us take a look at the magnitudes of these possible changepoints. You can look at this visualization with the following code:
deltas = model.params['delta'].mean(0)
fig = plt.figure(facecolor='w')
ax = fig.add_subplot(111)
ax.bar(range(len(deltas)), deltas)
ax.grid(True, which='major', c='gray', ls='-', lw=1, alpha=0.2)
ax.set_ylabel('Rate change')
ax.set_xlabel('Potential changepoint')
fig.tight_layout()
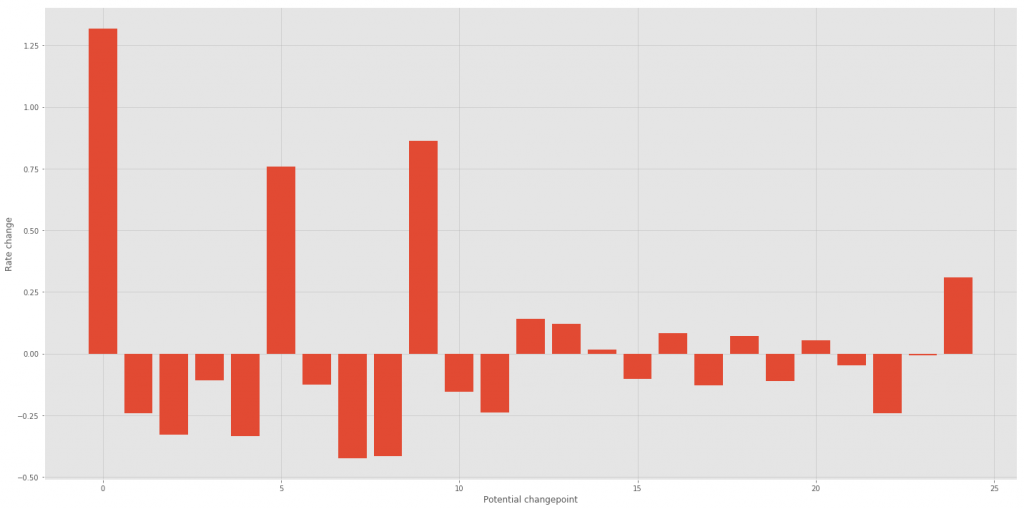
We can see from the above chart, that there are quite a few of these changes points (found between 10 and 20 on the chart) that are very minimal in magnitude and are most likely to be ignored by prophet during forecasting be used in the forecasting.
Now, if we know where trends changed in the past, we can add these known changepoints into our dataframe for use by Prophet. For this data, I’m going to use the FRED website to find some of the low points and high points to use as trend changepoints. Note: In actuality, just because there is a low or high doesn’t mean its a real changepoint or trend change, but let’s assume it does.
m = Prophet(changepoints=['2009-03-09', '2010-07-02', '2011-09-26', '2012-03-20', '2010-04-06'])
forecast = m.fit(df).predict(future)
m.plot(forecast);
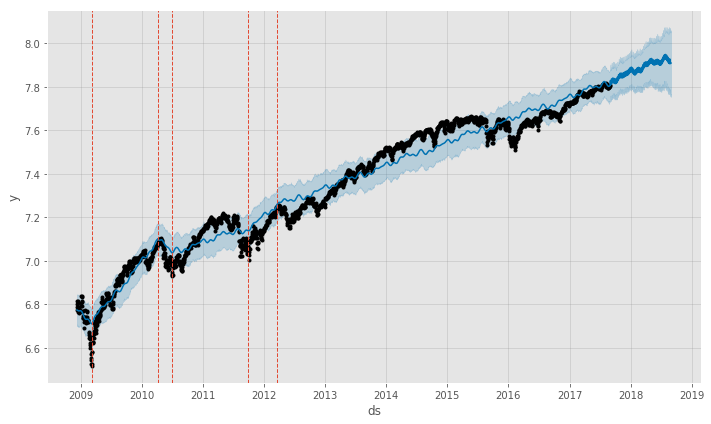
We can see that by manually setting our changepoints (and only using a few points), we drastically changed the model compared to the model that prophet built for us using the automatic detection of changepoints. Unless you are very sure about your trend changepoints in the past, its probably good to keep the defaults that prophet provides.
Conclusion
Prophet’s use (and accessibility) of trend changepoints is wonderful, especially for those signals / datasets that have significant changes in trend during the lifetime of the signal. That said, unless you are certain about your changepoints, it might be best to let prophet do its thing automatically.
Note: Please don’t think that because prophet does an OK job of forecasting the SP500 chart historically in this example that you should use it to ‘predict’ the markets. The markets are awfully tough to forecast…I used this market data because I knew there were some very clear changepoints in the data.
The post Forecasting Time Series data with Prophet – Trend Changepoints appeared first on Python Data.