Pandas is arguably the most important Python package for data science. Not only does it give you lots of methods and functions that make working with data easier, but it has been optimized for speed which gives you a significant advantage compared with working with numeric data using Python’s built-in functions.
The printable version of this cheat sheet
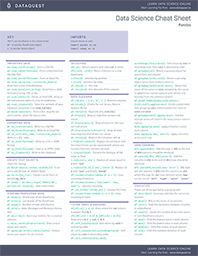
It’s common when first learning pandas to have trouble remembering all the functions and methods that you need, and while at Dataquest we advocate getting used to consulting the pandas documentation, sometimes it’s nice to have a handy reference, so we’ve put together this cheat sheet to help you out!
If you’re interested in learning pandas, you can consult our two-part pandas tutorial blog post, or you can signup for free and start learning pandas through our interactive pandas for data science course.
Download a Printable PDF of this Cheat Sheet
Key and Imports
In this cheat sheet, we use the following shorthand:
df |
Any pandas DataFrame object |
s |
Any pandas Series object |
You’ll also need to perform the following imports to get started:
import pandas as pd
import numpy as np
Importing Data
pd.read_csv(filename) |
From a CSV file |
pd.read_table(filename) |
From a delimited text file (like TSV) |
pd.read_excel(filename) |
From an Excel file |
pd.read_sql(query, connection_object) |
Read from a SQL table/database |
pd.read_json(json_string) |
Read from a JSON formatted string, URL or file. |
pd.read_html(url) |
Parses an html URL, string or file and extracts tables to a list of dataframes |
pd.read_clipboard() |
Takes the contents of your clipboard and passes it to read_table() |
pd.DataFrame(dict) |
From a dict, keys for columns names, values for data as lists |
Exporting Data
df.to_csv(filename) |
Write to a CSV file |
df.to_excel(filename) |
Write to an Excel file |
df.to_sql(table_name, connection_object) |
Write to a SQL table |
df.to_json(filename) |
Write to a file in JSON format |
Create Test Objects
Useful for testing code segements
pd.DataFrame(np.random.rand(20,5)) |
5 columns and 20 rows of random floats |
pd.Series(my_list) |
Create a series from an iterable my_list |
df.index = pd.date_range('1900/1/30', periods=df.shape[0]) |
Add a date index |
Viewing/Inspecting Data
df.head(n) |
First n rows of the DataFrame |
df.tail(n) |
Last n rows of the DataFrame |
df.shape() |
Number of rows and columns |
df.info() |
Index, Datatype and Memory information |
df.describe() |
Summary statistics for numerical columns |
s.value_counts(dropna=False) |
View unique values and counts |
df.apply(pd.Series.value_counts) |
Unique values and counts for all columns |
Selection
df[col] |
Return column with label col as Series |
df[[col1, col2]] |
Return Columns as a new DataFrame |
s.iloc[0] |
Selection by position |
s.loc['index_one'] |
Selection by index |
df.iloc[0,:] |
First row |
df.iloc[0,0] |
First element of first column |
Data Cleaning
df.columns = ['a','b','c'] |
Rename columns |
pd.isnull() |
Checks for null Values, Returns Boolean Arrray |
pd.notnull() |
Opposite of pd.isnull() |
df.dropna() |
Drop all rows that contain null values |
df.dropna(axis=1) |
Drop all columns that contain null values |
df.dropna(axis=1,thresh=n) |
Drop all rows have have less than n non null values |
df.fillna(x) |
Replace all null values with x |
s.fillna(s.mean()) |
Replace all null values with the mean (mean can be replaced with almost any function from the statistics section) |
s.astype(float) |
Convert the datatype of the series to float |
s.replace(1,'one') |
Replace all values equal to 1 with 'one' |
s.replace([1,3],['one','three']) |
Replace all 1 with 'one' and 3 with 'three' |
df.rename(columns=lambda x: x + 1) |
Mass renaming of columns |
df.rename(columns={'old_name': 'new_ name'}) |
Selective renaming |
df.set_index('column_one') |
Change the index |
df.rename(index=lambda x: x + 1) |
Mass renaming of index |
Filter, Sort & Groupby
df[df[col] > 0.5] |
Rows where the col column is greater than 0.5 |
df[(df[col] > 0.5) & (1.7)] |
Rows where 0.7 > col > 0.5 |
df.sort_values(col1) |
Sort values by col1 in ascending order |
df.sort_values(col2,ascending=False) |
Sort values by col2 in descending order |
df.sort_values([col1,ascending=[True,False]) |
Sort values by col1 in ascending order then col2 in descending order |
df.groupby(col) |
Return a groupby object for values from one column |
df.groupby([col1,col2]) |
Return groupby object for values from multiple columns |
df.groupby(col1)[col2] |
Return the mean of the values in col2, grouped by the values in col1 (mean can be replaced with almost any function from the statistics section) |
df.pivot_table(index=col1,values=[col2,col3],aggfunc=max) |
Create a pivot table that groups by col1 and calculates the mean of col2 and col3 |
df.groupby(col1).agg(np.mean) |
Find the average across all columns for every unique col1 group |
data.apply(np.mean) |
Apply a function across each column |
data.apply(np.max,axis=1) |
Apply a function across each row |
Join/Comine
df1.append(df2) |
Add the rows in df1 to the end of df2 (columns should be identical) |
df.concat([df1, df2],axis=1) |
Add the columns in df1 to the end of df2 (rows should be identical) |
df1.join(df2,on=col1,how='inner') |
SQL-style join the columns in df1 with the columns on df2 where the rows for col have identical values. how can be one of 'left', 'right', 'outer', 'inner' |
Statistics
These can all be applied to a series as well.
df.describe() |
Summary statistics for numerical columns |
df.mean() |
Return the mean of all columns |
df.corr() |
Finds the correlation between columns in a DataFrame. |
df.count() |
Counts the number of non-null values in each DataFrame column. |
df.max() |
Finds the highest value in each column. |
df.min() |
Finds the lowest value in each column. |
df.median() |
Finds the median of each column. |
df.std() |
Finds the standard deviation of each column. |
Download a printable version of this cheat sheet
If you’d like to download a printable version of this cheat sheet you can do so below.