
It is sometimes said that Python, compared to low-level languages such as C++, improves development time at the expense of runtime. Fortunately, there are a handful of ways to speed up operation runtime in Python without sacrificing ease of use. One option suited for fast numerical operations is NumPy, which deservedly bills itself as the […]
Category: NumPy

Jupyter Notebook for Beginners: A Tutorial
The Jupyter Notebook is an incredibly powerful tool for interactively developing and presenting data science projects. A notebook integrates code and its output into a single document that combines visualisations, narrative text, mathematical equations, and other rich media. The intuitive workflow promotes iterative and rapid development, making notebooks an increasingly popular choice at the heart […]
Pythonic Data Cleaning With NumPy and Pandas
Data scientists spend a large amount of their time cleaning datasets and getting them down to a form with which they can work. In fact, a lot of data scientists argue that the initial steps of obtaining and cleaning data constitute 80% of the job. Therefore, if you are just stepping into this field or […]
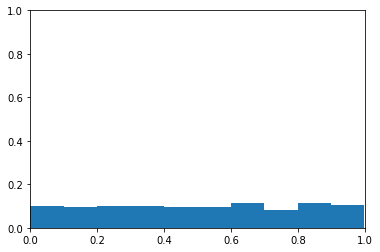
Exploring ROC Curves
I’ve always found ROC curves a little confusing. Particularly when it comes to ROC curves with imbalanced classes. This blog post is an exploration into receiver operating characteristic (i.e. ROC) curves and how they react to imbalanced classes. I start by loading the necessary libraries. 1 2 3 4 import numpy as np import matplotlib.pyplot […]
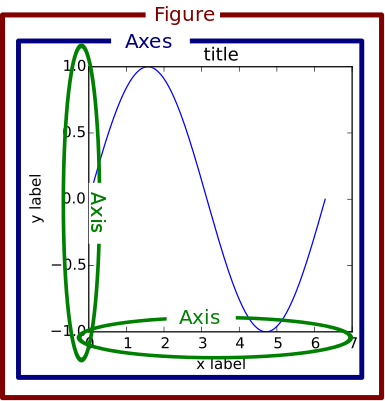
Python Plotting With Matplotlib (Guide)
A picture says a thousand words, and with Python’s matplotlib library, it fortunately takes far less than a thousand words of code to create a production-quality graphic. However, matplotlib is also a massive library, and getting a plot to look “just right” is often practiced on a trial-and-error basis. Using one-liners to generate basic plots […]
Simplifying Offline Python Deployments With Docker
In cases when a production server does not have access to the Internet or to the internal network, you will need to bundle up the Python dependencies (as wheel files) and interpreter along with the source code. This post looks at how to package up a Python project for distribution internally on a machine cut […]
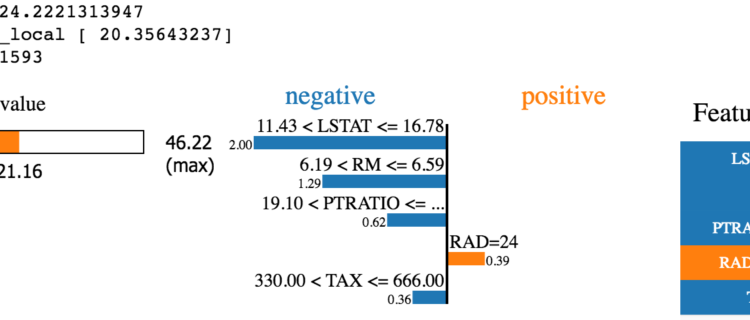
Local Interpretable Model-agnostic Explanations – LIME in Python
When working with classification and/or regression techniques, its always good to have the ability to ‘explain’ what your model is doing. Using Local Interpretable Model-agnostic Explanations (LIME), you now have the ability to quickly provide visual explanations of your model(s). Its quite easy to throw numbers or content into an algorithm and get a result […]
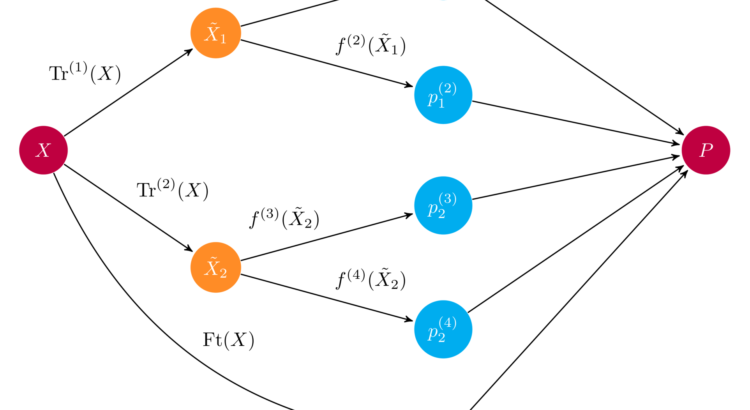
Introduction to Python Ensembles
Stacking models in Python efficiently Ensembles have rapidly become one of the hottest and most popular methods in applied machine learning. Virtually every winning Kaggle solution features them, and many data science pipelines have ensembles in them. Put simply, ensembles combine predictions from different models to generate a final prediction, and the more models we […]
Adding Axis Labels to Plots With pandas
Pandas plotting methods provide an easy way to plot pandas objects. Often though, you’d like to add axis labels, which involves understanding the intricacies of Matplotlib syntax. Thankfully, there’s a way to do this entirely using pandas. Let’s start by importing the required libraries: import pandas as pd import numpy as np import matplotlib.pyplot as […]

Pandas Concatenation Tutorial
You’d be hard pressed to find a data science project which doesn’t require multiple data sources to be combined together. Often times, data analysis calls for appending new rows to a table, pulling additional columns in, or in more complex cases, merging distinct tables on a common key. All of these tricks are handy to […]

Using Excel with pandas
Excel is one of the most popular and widely-used data tools; it’s hard to find an organization that doesn’t work with it in some way. From analysts, to sales VPs, to CEOs, various professionals use Excel for both quick stats and serious data crunching. With Excel being so pervasive, data professionals must be familiar with […]

Setting Up the PyData Stack on Windows
The speed of modern electronic devices allows us to crunch large amounts of data at home. However, these devices require the right software in order to reach peak performance. Luckily, it’s now easier than ever to set up your own data science environment. One of the most popular stacks for data science is PyData, a […]

Kaggle Fundamentals: The Titanic Competition
Kaggle is a site where people create algorithms and compete against machine learning practitioners around the world. Your algorithm wins the competition if it’s the most accurate on a particular data set. Kaggle is a fun way to practice your machine learning skills. This tutorial is based on part of our free, four-part course: Kaggle […]
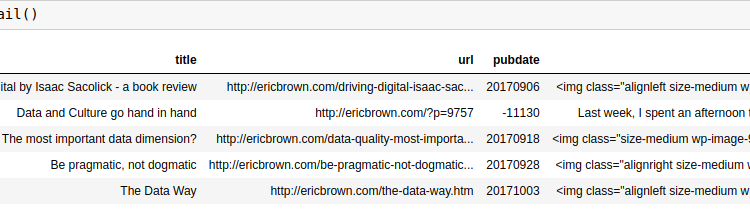
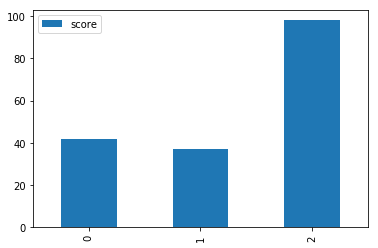
Text Analytics and Visualization
For this post, I want to describe a text analytics and visualization technique using a basic keyword extraction mechanism using nothing but a word counter to find the top 3 keywords from a corpus of articles that I’ve created from my blog at http://ericbrown.com. To create this corpus, I downloaded all of my blog posts […]

Explore Happiness Data Using Python Pivot Tables
One of the biggest challenges when facing a new data set is knowing where to start and what to focus on. Being able to quickly summarize hundreds of rows and columns can save you a lot of time and frustration. A simple tool you can use to achieve this is a pivot table, which helps […]