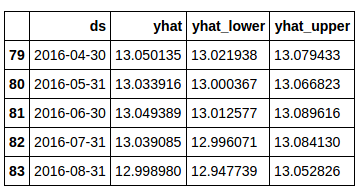
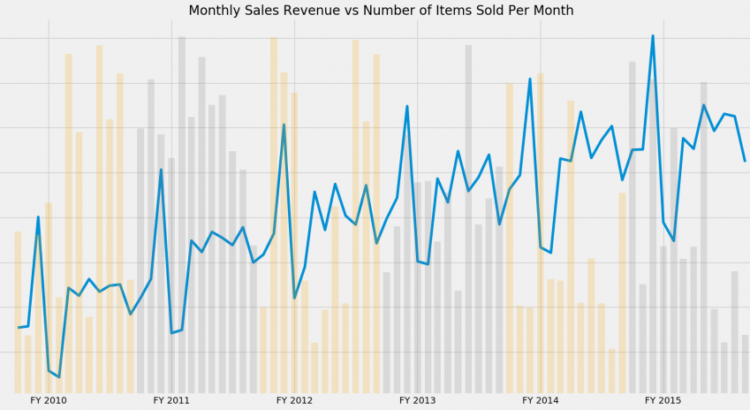
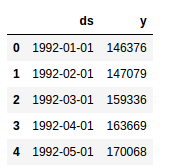
In Forecasting Time-Series data with Prophet – Part 1, I introduced Facebook’s Prophet library for time-series forecasting. In this article, I wanted to take some time to share how I work with the data after the forecasts. Specifically, I wanted to share some tips on how I visualize the Prophet forecasts using matplotlib rather than […]
Category: Data Analytics
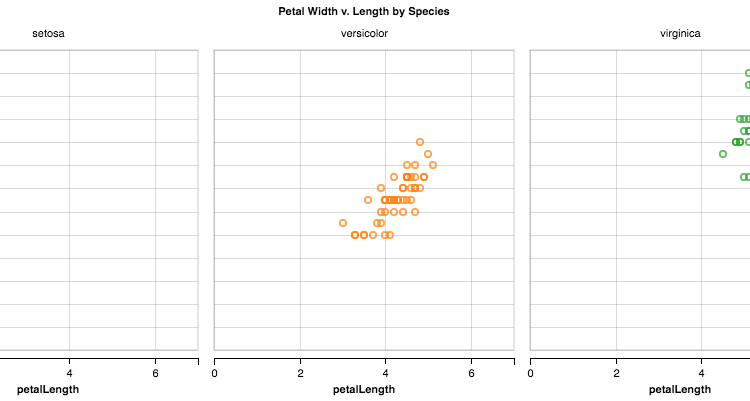
Visualizing data – overlaying charts in python
Visualizing data is vital to analyzing data. If you can’t see your data – and see it in multiple ways – you’ll have a hard time analyzing that data. There are quite a few ways to visualize data and, thankfully, with pandas, matplotlib and/or seaborn, you can make some pretty powerful visualizations during analysis. One of […]
Forecasting Time-Series data with Prophet – Part 1
This is part 1 of a series where I look at using Prophet for Time-Series forecasting in Python A lot of what I do in my data analytics work is understanding time series data, modeling that data and trying to forecast what might come next in that data. Over the years I’ve used many different […]
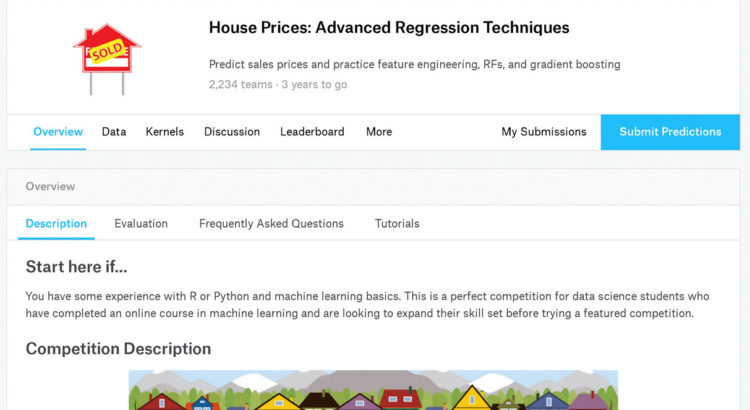
Getting Started with Kaggle: House Prices Competition
Founded in 2010, Kaggle is a Data Science platform where users can share, collaborate, and compete. One key feature of Kaggle is “Competitions”, which offers users the ability to practice on real world data and to test their skills with, and against, an international community. This guide will teach you how to approach and enter […]
Test Driven Development of a Django RESTful API
This post walks through the process of developing a CRUD-based RESTful API with Django and Django REST Framework, which is used for rapidly building RESTful APIs based on Django models. NOTE: Check out the third Real Python course for a more in-depth tutorial on Django REST Framework. This application uses: Python v3.6.0 Django v1.11.0 Django […]

How to become a data scientist
Data science is one of the most buzzed about fields right now, and data scientists are in extreme demand. And with good reason – data scientists are doing everything from creating self-driving cars to automatically captioning images. Given all the interesting applications, it makes sense that data science is a very sought-after career. Data science […]
A Dramatic Tour through Python’s Data Visualization Landscape (including ggpy and Altair)
by Dan Saber | April 19, 2017 This post originally appeared on Dan Saber’s blog. We thought it was hilarious, so we asked him if we could repost it. He generously agreed! About Dan: My name is Dan Saber. I’m a UCLA math grad, and I do Data Science at Coursera. (Before that, I worked […]
Data Science Things Roundup #10
Hey all, I haven’t done one of these in quite a while, but thought I’d share a few more articles I’ve found interesting recently. An analysis of twitter influencers in the field of data science & big data This is a pretty in depth medium article that goes through some of the concepts in network […]

NumPy Cheat Sheet – Python for Data Science
NumPy is the library that gives Python its ability to work with data at speed. Originally, launched in 1995 as ‘Numeric,’ NumPy is the foundation on which man importany Python data science libraries are built, including Pandas, SciPy and scikit-learn. The printable version of this cheat sheet It’s common when first learning NumPy to have […]
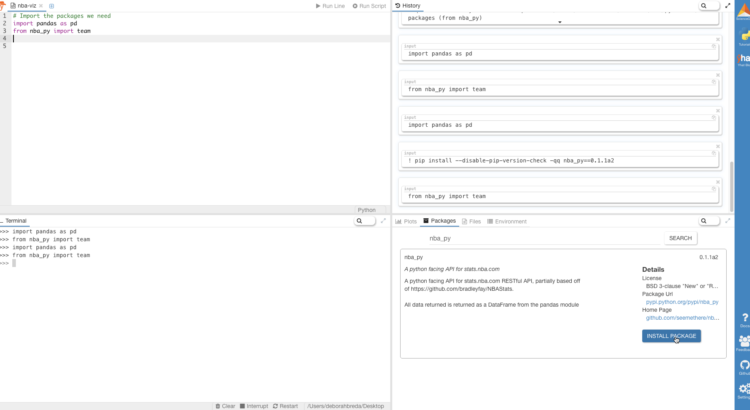
Data Wrangling 101: Using Python to Fetch, Manipulate & Visualize NBA Data
by Viraj Parekh | April 6, 2017 This is a basic tutorial using pandas and a few other packages to build a simple datapipe for getting NBA data. Even though this tutorial is done using NBA data, you don’t need to be an NBA fan to follow along. The same concepts and techniques can be […]
Python’s Instance, Class, and Static Methods Demystified
In this tutorial I’ll help demystify what’s behind class methods, static methods, and regular instance methods. If you develop an intuitive understanding for their differences you’ll be able to write object-oriented Python that communicates its intent more clearly and will be easier to maintain in the long run. This is a guest blog post by […]
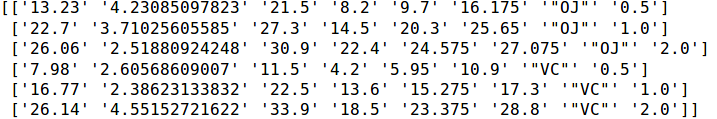
How to do Descriptive Statistics in Python using Numpy
In this short post we are going to revisit the topic on how to carry out summary/descriptive statistics in Python. In the previous post, I used Pandas (but also SciPy and Numpy, see Descriptive Statistics Using Python) but now we are only going to use Numpy. The descriptive statistics we are going to calculate are […]

How to do Descriptives Statistics in Python using Numpy
In this short post we are going to revisit the topic on how to carry out summary/descriptive statistics in Python. In the previous post, I used Pandas (but also SciPy and Numpy, see Descriptive Statistics Using Python) but now we are only going to use Numpy. The descriptive statistics we are going to calculate are […]
A Magical Introduction to Classification Algorithms
by Bryan Berend | March 23, 2017 About Bryan: Bryan is the Lead Data Scientist at Nielsen. Introduction When you first start learning about data science, one of the first things you learn about are classification algorithms. The concept behind these algorithms is pretty simple: take some information about a data point and place the […]

Turbocharge Your Data Acquisition using the data.world Python Library
When working with data, a key part of your workflow is finding and importing data sets. Being able to quickly locate data, understand it and combine it with other sources can be difficult. One tool to help with this is data.world, where you can search for, copy, analyze, and download data sets. In addition, you […]